東京工業大学大学院理工学研究科基礎物理学専攻中村研究室メンバー

ホームページおぼえがき > Topdrawerコードサンプル集

Topdrawerコードサンプル集

Topdrawerコードサンプル集。未来の自分のために、今書き残す (鶏頭)。Topdrawerおぼえがきには、もっと基本的なことを書くかも。

(incorrectなおぼえがき。)

データ点をプロット

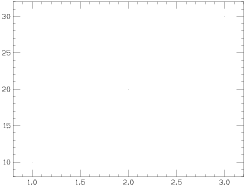
データ点をプロットするには、plot文を打つ。Topdrawerでは、コマンドとして数字を打ち込むとデータ点と見なされる。1列目でxの値、2列目でyの値を指定する。

1 10
2 20
3 30
plot

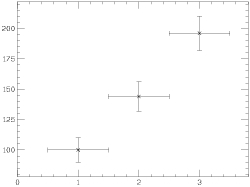
点の種類を変更する場合は、set symbol 1Pなどと打つ。点の種類の指定方法はCASE文と同様であり、具体的にはここを参照。例えば、set symbol 1Pとすれば×、set symbol 3Pとすれば□をデータ点とすることができる。データ点にエラーバーをつけたい場合、又は入力するデータの並びをxyでなくyxのように変更したい場合は、set order文を使う。

set symbol 1P
set order y x dx dy
100 1 0.5 10    
144 2 0.5 12
196 3 0.5 14
plot

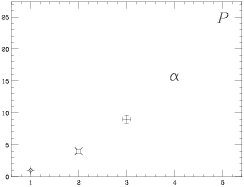
点ごとに点の種類を変更することもできる。set order x y symbolなどとすればよい。plot文では、点のサイズの変更も可能。

set font duplex
set order x y symbol
1 1 4P
2 4 5P
3 9 6P
4 16 AG
5 25 PI
plot size=5

データ点を曲線/直線で結ぶ

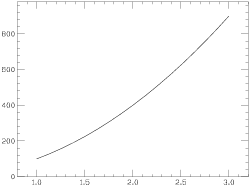
データ点を滑らかな曲線 (どんな曲線かはよくわからない) で結ぶには、plot文の代わりにjoin文を使う。

1 100 
2 400
3 900
join

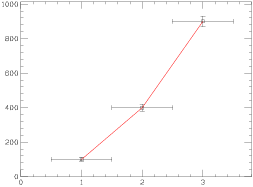
join 1とすれば、データ点を直線で結ぶ。join文は、plot文と併用することもできる。オプションにredとすれば、赤くなる。

set symbol 3P
1 100 0.5 10
2 400 0.5 20
3 900 0.5 30
plot
join 1 red

ヒストグラムを描く

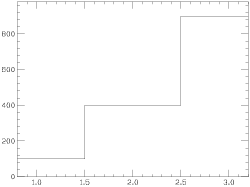
ヒストグラムを描くには、histogram文を用いる。データの指定方法は、plot文やjoin文と同じである。histogram文は、join文、plot文と併用することもできる (併用というよりも、単に上書きするだけ?)。

1 100
2 400
3 900
histogram

関数を描く

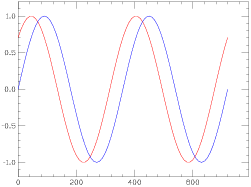
関数を直接描くコマンドはないかも。よって、描きたい関数から計算された値をX文とY文でデータ点として定義し、joinで結ぶ。y=" "にxの関数を書けばよいが、xの値を参照するには、xv (xvalueでも良い) とする。定数として128〜255は使えないかも?また、1文字の変数の参照ができないかも?

x=0 to 720 step 10
y="(1/sqrt(2))*(sin(xv)+cos(xv))"
join red
del all

x=0 to 720 step 10
y="sin(xv)"
join blue

使用可能な関数は以下の通り (Topdrawer reference manualから引用)。

     1.  [ARC]SINE - [inverse] Sine of angle in degrees
     2.  [A]COSINE - [inverse] Cosine of angle in degrees
     3.  [A]TANGENT - [inverse] Tangent of angle in degrees
     4.  RADIANS - Converts degrees to radians
     5.  DEGREES - Converts radians to degrees
     6.  GAMMA - GAMMA function (GAMMA(n)=(n-1)!) (Cern Library)
     7.  LOGARITHM - Log to the base 10
     8.  EXPONENTIAL - Power of e (inverse LN)
     9.  LN - Logarithm to the base e
    10.  SQRT - Square root
    11.  RANDOM - Random number.  RAN(0) produces a random number.  RAN(n)
         sets the seed to n and starts a new random number sequence.
    12.  ABSOLUTE - Absolute value
    13.  INTEGER - Integer part of a number
    14.  FRACTION - Fractional part of a number
    15.  NINTEGER - Nearest integer to a number
    16.  ERF - Error function (Cern Library)
    17.  ERFC - Error function (Cern Library)
    18.  FREQ - Frequency function (Cern Library)

タイトル/文字列を書く

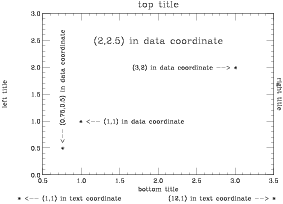
タイトル/文字を書くには、title文を用いる。title文の引数によって、タイトルの場所、角度 (angle)、大きさ (size) を変えることができる。set font duplexと書くと、表示される文字がきれいになる。

left (right, top, botom) を指定するとグラフの左 (右, 上, 下) にタイトルを表示する。ただし、topを指定すると、left, right, bottomよりも文字のサイズが大きくなる(topはsize=3、left, right, bottomはsize=2に相当)。また、left (bottom) を指定することと、y (x) を指定することは同じである。

data x,yとすると、data coordinate (座標の節を参照) のx,yのところに文字列を表示する。text x,yとすると、text coordinateのx,yに文字列を表示する。ljustify (rjustify) を指定すると、文字列の一番左 (右) の文字の中心が、文字列を配置する際の基準となる。centerを指定すれば、文字列の中心が基準となる。

set font duplex
set window x 2 12 y 2 9
set limits x 0.5 3.5 y 0 3
plot axis
title top "top title"
title bottom "bottom title"
title left "left title"
title right "right title"

title text 1,1 ljustify "* <-- (1,1) in text coordinate"
title text 12,1 rjustify "(12,1) in text coordinate --> *"
title data 1,1 ljustify "* <-- (1,1) in data coordinate"
title data 0.75,0.5 ljustify "* <-- (0.75,0.5) in data coordinate" angle=90
title data 3,2 rjustify "(3,2) in data coordinate --> *"
title data 2,2.5 center "(2,2.5) in data coordinate" size=3
plot title

目盛

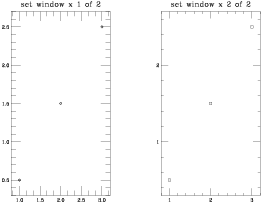
目盛 (ticks) の長さを調節するには、set ticks文を用いてset ticks 0.2などとする。set ticks long=2で、副目盛 (Small Ticks?) の長さを主目盛 (Big Ticks?) の長さの1/2にする。

x軸の主目盛間を3分割した場所に副目盛を配置するには、set scale x ticks=3とする。xy軸において副目盛を表示しないようにするには、set scale all ticks=1とする

主目盛には、その数値がラベルとして書かれる。xy軸の主目盛の最大数を3にするには、set scale all labels=3とする。

set font duplex

set window x 1 of 2
title top "set window x 1 of 2"
set ticks size=0.2 long=2
set scale x ticks=3
set symbol 2P
1 0.5
2 1.5
3 2.5
plot

set window x 2 of 2
title top "set window x 2 of 2"
set ticks size=0.1 long=3
set scale all labels=3 ticks=5
set symbol 3P
1 0.5
2 1.5
3 2.5
plot

ラベル

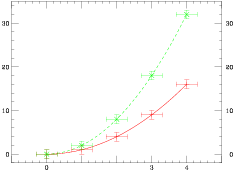
座標のスケールを表すラベルは、主目盛 (Big ticks?) に付けられる。ラベルを付ける間隔を変更したい場合は、主目盛の間隔を変更すれば良い。ラベルを付ける場所はグラフの上下左右から選択できる。例えば、右にもラベルを表示し、下のラベルを非表示とするには、set labels right on bottom offとする。すべてのラベルを非表示とするには、set labels all offとする。

Gnuplotのように、ラベルを付ける数値を選択することはできない (?)。よって、ラベルを付ける数値を選択したい場合は、ラベルの表示をOFFにし、title文を用いて自分で数値を書く (のか?)。

set font duplex

set window x 2.6 11.7 y 2 9
set limits x -1 to 5 y -2 to 35
set labels right on bottom off
title data 0,-3 center "0"
title data 3,-3 center "3"
title data 4,-3 center "4"

0 0 0.3 1
1 1 0.3 1
2 4 0.3 1
3 9 0.3 1
4 16 0.3 1
join width=2 red
plot symbol=0P size=3 red

0 0 0.3 1
1 2 0.3 1
2 8 0.3 1
3 18 0.3 1
4 32 0.3 1
join width=2 green dashes
plot symbol=1P size=3 green

軸の範囲設定

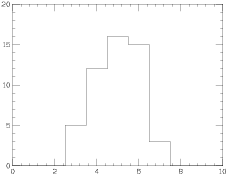
軸の範囲を設定したい場合、set limits文を用いる。set limits x 0 10 y 0 20とすれば、x軸の範囲を0から10、y軸の範囲を0から20に設定する。

set window x 2.6 11.7 y 2 9
set limits x 0 to 10 y 0 to 20
3 5
4 12
5 16
6 15
7 3
histo

座標

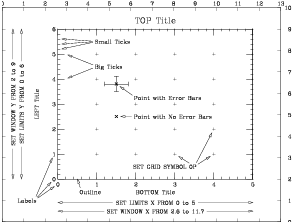
Topdrawerの描画領域は、グラフが描かれる座標とは別に独自の座標を持つ。描画領域の座標をtext coordinate、グラフの座標をdata coordinateと呼ぶ。text coodinateの範囲は、左下を原点としてxが0から13、yが0から10である。

data coodinateを描く場所は、text cordinateを用いてset window x 2.6 11.7 y 2 9などと指定する。data coodinateの範囲指定は、set limits x 0 to 5 y 0 to 6などと指定する。下図のグラフは、に描いてあるグラフをまねした。

set font duplex
set size x=14 y=11

set window x 0 13 y 0 10
set limits x 0 to 13 y 0 to 10
set labels all off top on right on
set ticks size=0.05
set scale x labels=13 ticks=1
set scale y labels=10 ticks=1
plot axis
set labels
set ticks
set scale all

set window x 2.6 11.7 y 2 9
set limits x 0 to 5 y 0 to 6
set grid symbol 0P
set shield from 0,0 to 2.6,10
set shield from 11.7,0 to 13,10
set shield from 0,0 to 13,2
set shield from 0,9 to 13,10
plot axis
set shield off
set grid off
plot axis

set symbol 1P
set order x y dx dy
1.5 3.8 0.3 0.3
set order x y
1.5 2.5
plot

title top "TOP Title"
title bottom "BOTTOM Title"
title 1.6,5.5 left "LEFT Title"

title 7.15,0.9 center "SET LIMITS X FROM 0 to 5"
arrow 5.15,0.9 to 2.6,0.9
arrow 9.15,0.9 to 11.7,0.9
title 7.15,0.5 center "SET WINDOW X FROM 2.6 to 11.7"
arrow 4.75,0.5 to 2.6,0.5
arrow 9.55,0.5 to 11.7,0.5
title 0.90,5.5 center angle=90 "SET LIMITS Y FROM 0 to 6"
arrow 0.90,3.5 to 0.90,2
arrow 0.90,7.5 to 0.90,9
title 0.50,5.5 center angle=90 "SET WINDOW Y FROM 2 to 9"
arrow 0.50,3.4 to 0.50,2
arrow 0.50,7.6 to 0.50,9

title 3.7,1.4 ljust "Outline"
arrow 3.7,1.4 less=0.2 to 0.5,0 data
title 1.5,1 rjust "Labels"
arrow 1.5,1 less=0.2 to 0,-0.2 less=0.2 data
arrow 1.5,1 less=0.2 to -0.1,0 less=0.2 data
arrow 1.5,1 less=0.2 to -0.1,1 less=0.2 data
title data 1,5.5 ljust "Small Ticks"
arrow data 1,5.5 less=0.2 to 0.1,5.2 data
arrow data 1,5.5 less=0.2 to 0.1,5.4 data
arrow data 1,5.5 less=0.2 to 0.1,5.6 data
title data 1,4.5 ljust "Big Ticks"
arrow data 1,4.5 less=0.2 to 0.2,4 less=0.1 data
arrow data 1,4.5 less=0.2 to 0.2,5 less=0.1 data
title data 2,3.25 ljust "Point with Error Bars"
arrow data 2,3.25 less=0.2 to 1.5,3.8 less=0.2 data
title data 2,2.5  ljust "Point with No Error Bars"
arrow data 2,2.5  less=0.2 to 1.5,2.5 less=0.2 data
title data 3.5,0.5 rjust "SET GRID SYMBOL 0P"
arrow data 3.5,0.5 less=0.3 to 3,1 less=0.2 data
arrow data 3.5,0.5 less=0.2 to 4,1 less=0.2 data
arrow data 3.5,0.5 less=0.2 to 4,2 less=0.2 data
plot title

グラフを描く場所を指定する

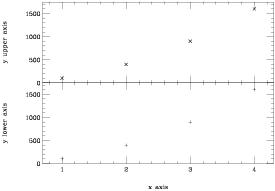
グラフを描く場所を指定するには、set window文を用いる。

set font duplex

title 7,1 "x axis" center
set window x 2 12 y 2 5.5
title left "y lower axis"
(title 0.5,3.75 "y lower axis" center angle=90
set symbol 0P
1 100
2 400
3 900
4 1600
plot

set window x 2 12 y 5.5 9
title left "y upper axis"
(title 0.5,7.25 "y upper axis" center angle=90
set label bottom off
set symbol 1P
1 100
2 400
3 900
4 1600
plot

描画領域を分割し各々にグラフを書く

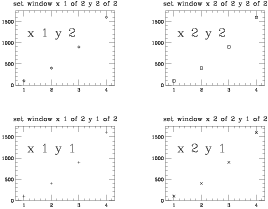
描画領域を分割し各々にグラフを書くには、set window文を用いる。PAWのzoneコマンドに似ている。ただし、分割した画面の配置は左下が基準であり、x 1 y 1が左下の領域を表す。分割したときの各々のグラフは、分割しない時よりも小さくなる。

set font duplex

set window x 1 of 2 y 1 of 2
title top "set window x 1 of 2 y 1 of 2"
set symbol 0P
1 100
2 400
3 900
4 1600
plot
title 2,1250 "x 1 y 1" data center size=4

set window x 2 of 2 y 1 of 2
title top "set window x 2 of 2 y 1 of 2"
set symbol 1P
1 100
2 400
3 900
4 1600
plot
title 2,1250 "x 2 y 1" data center size=4

set window x 1 of 2 y 2 of 2
title top "set window x 1 of 2 y 2 of 2"
set symbol 2P
1 100
2 400
3 900
4 1600
plot
title 2,1250 "x 1 y 2" data center size=4

set window x 2 of 2 y 2 of 2
title top "set window x 2 of 2 y 2 of 2"
set symbol 3P
1 100
2 400
3 900
4 1600
plot
title 2,1250 "x 2 y 2" data center size=4
plot title

極座標でグラフを書く

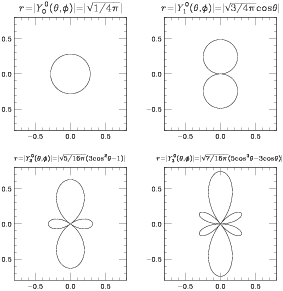
極座標を用いるには、set polar [deg|rad]とする。degは度、radはラジアン。デフォルトはdeg。

set size 12 12
set polar
set font duplex

set window x 0.5 5 y 6.5 11
set limits x -0.8 0.8 y -0.8 0.8 
title top "r=|Y42034001(Q,F)|=|24VVVV51/4P5|"
case      "I  IUC CUC C G G    SCSSSSC   GU "
th=0 to 360 step 1
ra="abs(sqrt(1/(4*pi)))"
th = th + 90
join
plot axis
del all

set window x 6.5 11 y 6.5 11
set limits x -0.8 0.8 y -0.8 0.8 
title top "r=|Y42134001(Q,F)|=|24VVVV53/4P5cosQ|"
case      "I  IUC CUC C G G    SCSSSSC   GU   G "
th=0 to 360 step 1
ra="abs(sqrt(3/(4*pi))*cos(thv))"
th = th + 90
join
plot axis
del all

set window x 0.5 5 y 0.5 5
set limits x -0.8 0.8 y -0.8 0.8 
title top "r=|Y42234001(Q,F)|=|24VVVVV55/16P5(3cos021Q-1)|" size=2
case      "I  IUC CUC C G G    SCSSSSSC    GU     C CG    "
th=0 to 360 step 1
ra="abs(sqrt(5/(16*pi))*(3*cos(thv)*cos(thv)-1))"
th = th + 90
join
plot axis
del all

set window x 6.5 11 y 0.5 5
set limits x -0.8 0.8 y -0.8 0.8 
title top "r=|Y42334001(Q,F)|=|24VVVVV57/16P5(5cos031Q-3cosQ)|" size=2
case      "I  IUC CUC C G G    SCSSSSSC    GU     C CG     G  "
th=0 to 360 step 1
ra="abs(sqrt(7/(16*pi))*(5*cos(thv)*cos(thv)*cos(thv)-3*cos(thv)))"
th = th + 90
join
plot axis
del all

ローレンツ関数を書く

set font duplex

title top "Lorentzian Function (G=1, x203=0)"
case      "                     H    IC C   "    
define value a=1.0
define value gamma=1.0
define value x0=0.0
define value max=<2/(pi*v_gamma)>
define value hmax=<1/(pi*v_gamma)>
define value qmax=<1/(2*pi*v_gamma)>


x=-5 to 5 step 0.01
y="(v_a/pi)*(v_gamma/2)/((xv-v_x0)*(xv-v_x0)+(v_gamma/2)*(v_gamma/2))"
join

title data 4,<hmax> "2/PG" center
case                "  GH"
arrow data 4,<hmax> less=0.3 to data 4,0
arrow data 4,<hmax> less=0.3 to data 4,<max>
arrow data 0,<max>  less=0.3 to data 4.2,<max> size=0

title data 2,<qmax> "1/PG" center
case                "  GH"
arrow data 2,<qmax> less=0.3 to data 2,0
arrow data 2,<qmax> less=0.3 to data 2,<hmax>
arrow data 0,<hmax> less=0.6 to data 2.2,<hmax> size=0

title data 0,<v_hmax-0.02> "G" center
case                       "H"
arrow data 0,<hmax> to data <v_gamma/2>,<hmax>
arrow data 0,<hmax> to data <-v_gamma/2>,<hmax>

plot title

仮想光子数

 set font duplex
 set window x 3 11 y 1 9
 set scal y lo
 set limit x 0.2 10
 set limit y 20 1000
 title top "Calculated E1 virtual photon numbers"
 title bottom "E2G3 (MeV)"
 case         "ICGC      "
 title left   "n2E13(E2G3)"
 case         " CI C ICGC "
 title data 7.5,750 center "Pb target"
 title data 7.5,650 center "b2cut3=11.34 fm"
 case                      " C   C         "
  0.2  834.24913;  0.69  541.535615;  1.18  413.419923;  1.67  331.043076;
  2.16  271.29778;  2.65  225.379978;  3.14  188.900445;  3.63  159.306536;
  4.12  134.95725;  4.61  114.721785;  5.1  97.7810102;  5.59  83.5193025;
  6.08  71.4610088;  6.57  61.2307811;  7.06  52.5275471;  7.55  45.1067024;
  8.04  38.767495;  8.53  33.3438188;  9.02  28.6973281;  9.51  24.7121772;
  10.  21.2909304;
 join
  0.2  321.770278;  0.69  226.361246;  1.18  184.891165;  1.67  158.053841;
  2.16  138.246094;  2.65  122.616713;  3.14  109.778691;  3.63  98.9493612;
  4.12  89.6417228;  4.61  81.5308214;  5.1  74.388112;  5.59  68.0461067;
  6.08  62.3779444;  6.57  57.2849038;  7.06  52.6884159;  7.55  48.5247572;
  8.04  44.741408;  8.53  41.2944836;  9.02  38.1468771;  9.51  35.2668896;
  10.  32.6271985;
 join
  0.2  205.976335;  0.69  151.36785;  1.18  127.721062;  1.67  112.441576;
  2.16  101.154468;  2.65  92.2198562;  3.14  84.8416293;  3.63  78.5722272;
  4.12  73.1346591;  4.61  68.3453766;  5.1  64.076352;  5.59  60.234641;
  6.08  56.750566;  6.57  53.5704946;  7.06  50.652223;  7.55  47.9619108;
  8.04  45.4719826;  8.53  43.1596497;  9.02  41.005846;  9.51  38.994445;
  10.  37.1116741;
 join
 title data 1.8,400  ljust "70 MeV/nucleon"  angle=-45
 title data 1.8,180  ljust "280 MeV/nucleon" angle=-30
 title data 1.8,90   ljust "800 MeV/nucleon" angle=-20
 plot title

液体水素標的の圧力、温度を表示する

lh2_datはこれ

set device postscript orient=3 file="tmp.ps"
set size 12 15
set font duplex
define command include "set file input="

set label bottom off

set window x 2 12 y 10 14
(set limit y -3.7 -3.3
title left "Cell Pressure (hPa)"
set order y dummy dummy dummy dummy x
include "lh2_dat"
join 1 width=3

set window x 2 12 y 6 10
(set limit y 87.5 92.5
title left "Shield Temperature (K)"
set order dummy y dummy dummy dummy x
include "lh2_dat"
join 1 width=3

set label bottom on

set window x 2 12 y 2 6
(set limit y 9.5 10.5
title bottom "time (hour)"
title left "Cell Temperature (K)"
set order dummy dummy y dummy dummy x
include "lh2_dat"
join 1 width=3

参考文献・webページ


ページ制作履歴
2008/09/15 制作開始
2008/09/24 webにアップ